The Role Of Infographics In Times Of Pandemic Like COVID-19
As the COVID-19 outbreak began devastating the world in the early part of 2020, it was quite a challenge for medical practitioners to disseminate pertinent information about it and, at the same time, make that information easy to comprehend for non-medical practitioners.
At first, I personally found it difficult to wrap my head around what was going on because my brain is just too slow to understand Science and any concept that’s related to it.
Seeing and interacting are deemed the most effective means of learning. Visual presentations make it easy for ordinary people to understand information and data. However, presenting a relatively complex idea is not a piece of cake.
Hence, an attractive and informative infographic that is easy to comprehend plays an important role in disseminating information and even increasing your site’s link relevance. Here lies the importance of infographics during a pandemic.
An Infographic Simplifies Complex Data

Most of us, if not all, might have already come across this prominent adage that says, “A picture is worth a thousand words.” Wouldn’t it be nifty and efficient if we were presented with an infographic containing all the essential information we need about a pandemic, instead of being handed a pile of research data written in boring and lengthy words?
An infographic is considered to be an effective means of simplifying complex data. The information and knowledge it conveys should be clean, clear, and concise so as to ensure that the graphic will be easy for readers to comprehend.
Even the most novice of readers would be quick to understand an infographic when it is able to convey information given the little space that you have.
An Infographic Enhances Your Credibility
Infographics go beyond showing how good your organization is when dealing with aesthetics. They also show how credible your knowledge is. What makes your infographics credible is its ability to be understood.
When you present data using an infographic, you are informing your recipients that you are an expert of a particular field.
You are giving your audience the product of a comprehensive research that took you time, knowledge, and experience. Your audience didn’t have that information after you gave it to them through your infographics.
However, always think smart. Not all the data you have gathered from your extensive research should have a room in your infographics.
Remember, you want your output to be concise yet impactful, not lengthy and monotonous. Eliminate unnecessary data and include only those that you deem necessary.
Infographics Are Attention-Grabbing
According to Wiley Education Services, it takes far less time to understand images rather than pure text.
Visual representations, such as graphs, charts, and diagrams, are effective means of getting information across since 65 percent of people are visual learners.
Given an individual’s short attention span, an infographic is the most engaging collateral that can be leveraged.
An infographic makes it easy for people to understand your message and remember it even after they finish scanning the document.
And come on, let’s just admit it. We tend to remember things better when we see them and not just read.
Infographics Aid Better Information Retention
Infographics are powerful tools to share knowledge to the world without being dull. Learning doesn’t stop the moment we finish our studies.
Instead, our desire to acquire more knowledge fortifies as we grow. Who doesn’t love learning, right? When the health crisis brought about by the novel coronavirus or SARS-COV-2 hit the world, credible health facilities such as the World Health Organization released infographics to inform the public as to how people can help stop the spread of the virus.
Infographics can aid the recall of the precautionary measures to follow in times like this by highlighting the most important standard health protocols.
This reinforces the importance of infographics — they help ensure public compliance to health protocols to stop transmission.
Use This Infographic Maker To Your Advantage!
A pandemic does not just pose a threat to one’s health but also to industries such as tourism, services, and food. Infographics are powerful tools to help businesses stay afloat despite facing challenges brought by health emergencies as they can promote your products and services both online and offline.
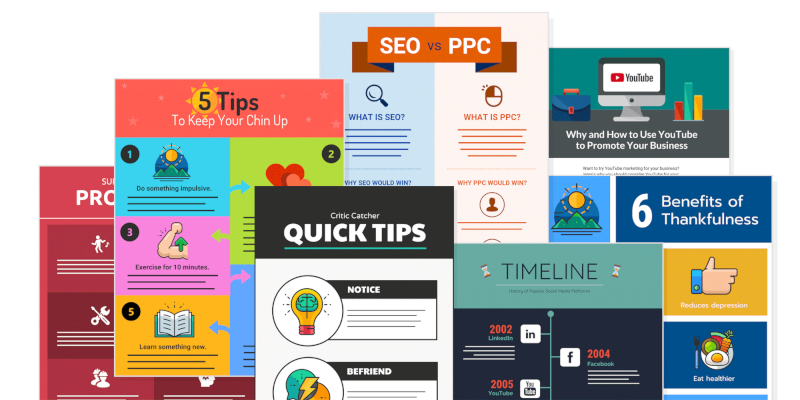
Tap your creativity through an infographic maker like Venngage! Choose the perfect template for your infographics needs and partner it with the equally perfect color scheme, illustrations, and icons.
After gathering essential facts and figures, you can deliver them using Venngage’s stunning templates, and you are well on your way to coming up with an informative and compelling infographic.
All you have to do is pick the template that matches your envisioned design then enhance some factors (color scheme, font style and size, and images) according to your own preference.
You have to make it a point that your infographics are visually pleasing and can deliver concise yet comprehensive information to the public.