Hey there. Reading blogs because you’re procrastinating creating that business report that’s long overdue? We feel you. Making a good business report is nobody’s favorite activity, and that often shows in the end result.
But business reports are necessary and if done right can be a great resource for your clients, stakeholders and employees. They lay strong foundations for taking business decisions in the future. They get investors on board.
That’s a lot of pressure, we know. But with the right tips and tricks, and a structured approach, anyone can create a business report that is easy to read, yet very effective.
From information design to using the right words, here are our top six tips to make your next business report the best one yet.
Got no time to lose? Here are the tips in short
- If you create business reports frequently, consider setting up guidelines or even creating templates to make the process easier, and be more consistent in how you present your brand and data.
- Whenever you type out numbers and percentages, ask yourself: could this be put into any type of chart? If the answer is yes: do it.
- People are visual learners. We don’t love to read, especially not business reports. If you want to present a timeline, fun facts, stats, anything really: showcase them in an infographic.
- KISS! Keep it simple, stupid. No need to impress colleagues with your broad vocabulary that you borrowed from synonyms.com. It’s much more impressive to write a report that’s easy to understand than it is to use jargon.
#1. Create clear guidelines, or even a template
Chances are, this won’t be your first business report, and definitely not your last. As to not having to revisit this particular blog in the future (we’d love to have you back, though!), here’s the top tip for creating great business reports.
Set standards. Create guidelines. Even better: create a template that you and anyone in your organization can fall back on in the future.
Not only will this make it easier to create the reports, there’s also more unity in what they look like. Consistency is what branding is all about, and business reports, especially meant for external use, shouldn’t be overlooked.
In the guidelines or template you can set examples for the use of colors, fonts and layouts. Creativity is great, but too much of it on one page will raise more questions than answer them.
Set standards for how long paragraphs can be (short!) and how one should refer to images or graphs. Your future self will thank you.
#2. Put all possible data in charts
Are you writing down percentages of happy customers? Talking about the remarkable growth in returning customers over the past few months? Stop right there.
Show, don’t tell. Information is processed much better when it’s visual, especially if numbers are involved. It gives your reader a very welcome break from reading, plus it can be shared much easier.
Research has shown that graphs are 25.5% faster to understand than text and 46.5% faster than tables. That data can’t really be put in a pie chart, by the way, but you get the picture.
No need to be a math wizard or know anything about design: you can use Piktochart’s pie chart maker to instantly create impressive charts that are easy to read.
If you feel like charts are dull, feel free to spice things up with extra visual elements and colors. Turns out, people remember charts even better when they come with strong visual images. Plain charts tend to blend in with text more.

#3. Add infographics to make your business report shorter and more engaging
Another crucial aspect of information design is infographics. They are great. They are able to capture the most important things in your business report, and showcase them in a fun visual that is easy to share, process and remember.
Infographics can show timelines, key points, fun facts and statistics. Why not put those things into words? Again, you’re doing it for the reader.
Visuals trump text in communication almost every time. Our brains are able to process images in as little as 13 milliseconds. You can’t even snap your fingers that fast. Now think about the last time you read a page three times to understand it and how long it took you.
Infographics make your business report more understandable. They’re also a great place to double down on your branding: you can tailor them to fit your style, and they are ready to be shared on social media.
#4. Why, oh why? Define a goal for your business report to cut through the noise
Before you start writing your business report, stop and think about why you’re writing it. What is the purpose of it? What is your reader supposed to do after reading it, and what information helps her to do that?
Setting a clear objective for your business report will help you filter data. That means less writing and sifting through data for you, and less fluff for your reader. It will guide you to get straight to the point and only include relevant data. Less is really more.
When you’ve set a goal, create a pathway that will guide your readers in a logical, chronological order. Too often we simply begin writing with the knowledge we have, disregarding what should come first or what our beloved readers may or may not know.
An outline will work like one of those paint by numbers kits. They could turn the colour-blind into Picasso, and they can turn you into a great business report writer.
#5. Give your readers some space
We urge you to hit ‘enter’ a bit more often in business reports. We often learn to write reports in an academic environment, meaning that pages must be filled to the rim with information. You present your readers with something that was once a white page, now cramped up with words.
They look at it and start sweating. There are no titles, no bullet points, not even a white space between important paragraphs. In the distance, sirens.
It’s so much more relaxing to look at a page and instantly see what you can expect. Titles that indicate what topic will be talked about next make it easier for readers who want to come back to the report and find that important piece of information.
Nobody wants to read the whole thing all over again just to find that one statistic they wanted to bring up in an argument.
#6. Write engaging, simple copy
What if we all spoke like news anchors, holding in the ‘uhm’s’ and ‘eh’s’? What if we talked like they do in movies, barely interrupting each other, only for dramatic effect? We’ve learned to talk like real humans, luckily, and haven’t adopted those forced forms of communications.
But then we started writing. More specifically: writing formal, professional content. Suddenly, we threw everything we knew about normal communication out the window. Sentences became long-winded. We used the most posh synonym of a word we could find. All to sound smart, leaving our readers feeling the opposite.
When writing for professional purposes, language is too often too stiff and stuffed with jargon. Let’s be honest here: business reports are rarely fun to read. You want to do it just once, and then be done with it. You want to get it, the first try.
Do your readers the favor of keeping the language in your business report simple. Keep sentences short. Use words they understand and use in their daily life. A well-written business report that is easy to read is much more impressive than a mash-up of a dictionary.
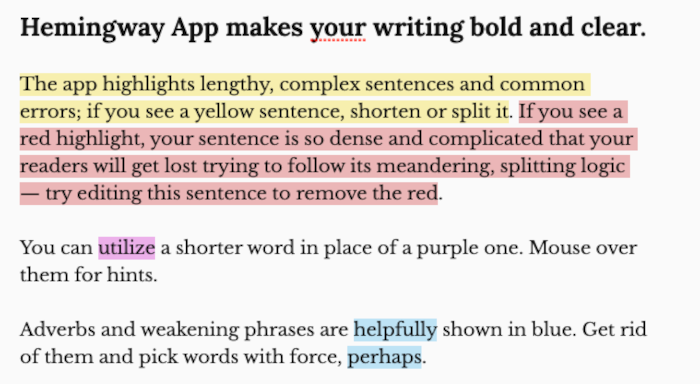
If you’re more of a Shakespeare than just a simple William and tend to fill up your business reports with incomprehensible words, try using the Hemingway Editor. This free tool helps you declutter your writing.
Now, go forth and create awesome business reports
The art of making good-looking, valuable and informative business reports is not lost yet. It takes practice, a lot of editing and critical feedback, but you too can create a business report that people don’t dread to read.
Our last piece of advice? Get an extra set of eyes to look at it. Most of the time, you are so deep into it that you can’t spot mistakes or identify what makes sense or not. Put the document away for at least twenty-four hours—we also recommend sleep—and revisit it with fresh eyes and someone else’s opinion. It doesn’t have to be perfect right away.