The Complete Guide of Creating Amazing Infographics
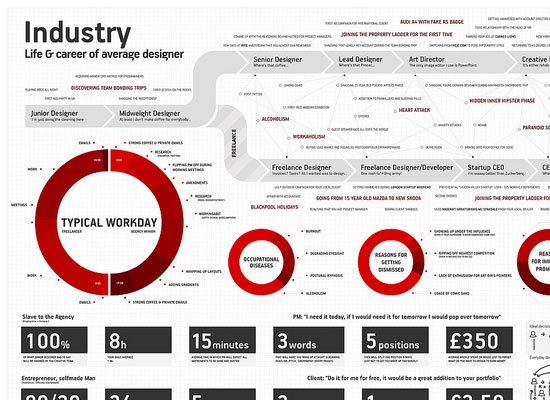
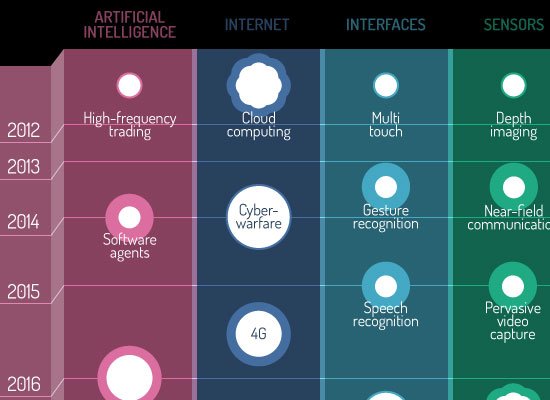
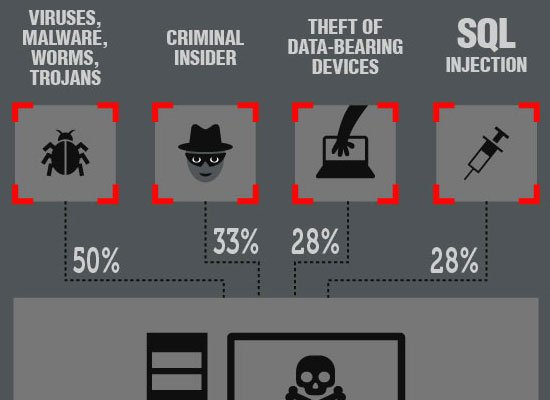
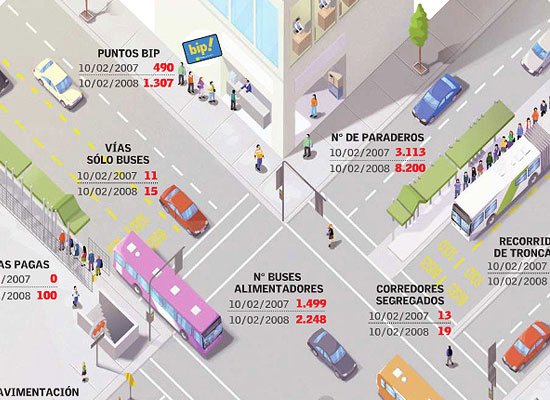
No matter how complicated or how beautiful a website is, the main purpose of it remains to offer information. Extremely few websites are specially created just for design. There is a hot debate between people crafting websites about which is the most important part of a website: the design or the written content? This “fight” has only positive effects, but what is more important, the fight battle was enlarged- nowadays we have another “hot land” – the infographics. These pieces of design consist in the visual representation of the information. The idea is simple and effective: instead of some plain papers of information, it may be better structured into a nice design visualisation. In this way it’s avoided the boredom of the viewer and a good design may really boost his attention. If you are still unconvinced about what supposes an infographic and which are its super powers, the next examples will help you making a better idea.
[Click the image to enlarge]


These are nice but there is still remaining the dilemma: which is the most important, the written information or the design of the infographic? Personally, I think that this debate will last for the next years, and it has only positive aspects, but what really matters is the fact that the viewer isn’t judging about design vs. content, he appreciates the final result- the infographic. The conclusion is obvious: the design community is dividing the websites or the infographics in two components, but the users judge the entire structure as a single entity. This is equivalent with the fact that there is no competition between design and written content, the real competition is between infographics.
I hope that this logical enhancement will moderate the dispute and people will focus more on what is provided to the user. Another hot debate about infographics is how to effectively create one: some people recommend using special software or applications while others are still in love with Photoshop and prefer the “old” solution. In this case, I consider the best solution the sharing of everyone’s ideas about- the more opinions, the better for everyone. Each designer has his particularities but everyone should try other ideas and techniques. As you probably guessed, here I propose my own manner of creating infographics. I must warn you that the next steps aren’t fixed and you shouldn’t fully respect my idea. I will be super satisfied if you extract two or three tips and insert them into your manner of work…Once again, nothing is stone carved!
[afiliasiinfographicsdeal]
Step 1: Determining the type and the features of the project
According to my personal style of work, when creating a new infographic, the first stage supposes to determine the type of project and eventually to identify the main features of it. This phase is very important because now is realized the matching between the subject of the infographic and the design of it. The subject of the infographic, but also the content and the design should work as a single entity in order to have a clear message; else the viewer is put in a complicated situation. Let’s assume that a designer should create an infographic about banking system, he must use some specific colors and also, he must use a vocabulary partially related to the domain (of course, he must avoid the very specific terms that annoy the people not familiarised with). Well, by lacking the consistence of the message you may imagine an infographic that is banking related but having funny icons and a very informal style, almost jovial. Would it be appreciated? I am in doubt…
Step 2: The information gathering
Once the previous step is finished, the next phase means working a lot. Lots of people use the expressions “working hard” or “working a lot” but a good infographic really means a huge volume of work. Firstly, it’s required to search for information- initially is about a raw bulk of data. The more, the better!
Step 3: The data structuration
It’s not enough to have all the information available; it’s more important to structure it, then extract what is important and interesting. An infographic with good data but having nothing new or interesting is useless; a great design that presents multiplication table is no use, isn’t it? The information processing is capital…in fact it is the essence of the infographic. In conclusion, even if it means to repeat step two and three, don’t be rushed and try to offer important and interesting information.
Step 4: Effective design + inserting the information
At this phase we may state that the written content of the infographic is finished and the next task is to realize the effective design. As I previously mentioned, the design may be realized using a template that may be downloaded from various websites or a software that generates the “skeleton” of an infographic. The best method is still Adobe Photoshop or any similar software- in this way is assured the uniqueness of the result. It’s true, it requires a huger volume of work and much time but it’s the guaranty that none will have a similar infographic to you.
Once created the framework is time to effectively add the text. I consider this act as being the one that proves the virtuosity of the crafter. It’s impossible to create an universal solution- each designer should balance all the aspects and finally create the result. The single decent advice is to study very carefully the above infographics and apply in practice what you appreciate the most.
Step 5: Feedback + revisions
Feedback is important in any activity and every designer, even the most experienced, should ask for the feedback of other designers. Of course, everyone is a good source of feedback, but a designer is expected to offer a more detailed answer. The idea to keep in mind is simple: being implied in creating a good product doesn’t let you see some details that are obvious for others.
Step 6: Optional Advertising and social media buzz
Supposing that the infographic is created for a client, then this step shouldn’t be taken into account. The designer sold it and the client is free to do whatever he wants with it. The other case means that the work is created to be added into the portfolio or just to attract viewers and why not, to transform them into clients. Well, nowadays, due to the huge possibilities, even if the infographic just created is awesome, the chances of being visible are still very low. In order to have it appreciated, the designer should make some buzz around it: social media, showcasing it in infographic galleries, presenting on various blogs are just the most common strategies. Anyway, it’s not enough to create a wonderful infographic and keep it on your hard drive!
In the end, I hope that this post is useful for anyone interested in creating infographics and I believe that once read this post, the reader will have a more complete idea about what this kind of design product supposes.
– Written by Daniel –